
From Intuition to Insight: Case study ‘Athlete 12' - Part 2
- Sep 19, 2025
- 8 min read
Welcome to the third and final part of our series on the use of data in judo. In the previous articles, we looked at the benchmark for top judoka and which assumptions Sporter 12 could work on to close the gap with the best. Now we take it a step further.
Our focus: the four assumptions about Sporter 12, the example athlete we follow:
Increasing the expected number of scores per match in tachi-waza.
Decreasing the expected number of scores against in tachi-waza.
Capitalizing on potentially already strong performances in ne-waza.
Increasing the positive difference between the total expected scores for and against per match.
But these assumptions are just the beginning. To take clear steps, we must critically examine them. Are they correct? Where are the opportunities? And most importantly: how do we put these insights into practice?
Step by step towards insight and action
In this article, we guide you step by step. We show how you can use data combined with experience and insight to answer these questions. No complicated theory, just as clear a practical explanation as possible to help you and your team make better choices, train more effectively, and sharpen your strategy.
We combine facts from data with years of experience to work together on growth. Because only with the right information can you be sure that your time, energy, and resources are spent on what truly contributes to your goals.
So let's take the next step: examine the data behind our assumptions, extract valuable insights from that data, and translate those into concrete advice. That way, we turn numbers into actions and those actions are necessary to reach the end goal.
Expected number of scores in tachi-waza
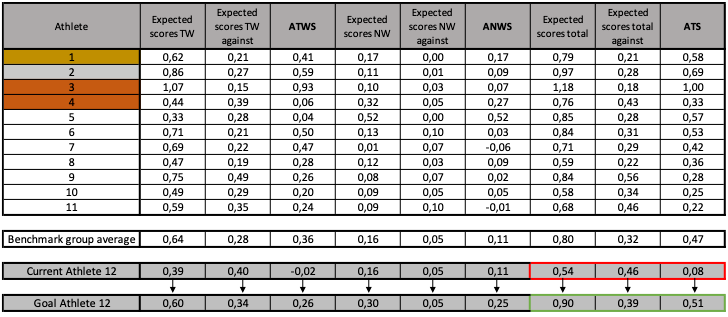
In the previous piece, we looked at data regarding tachi-waza and saw that the athlete we guide, Sporter 12, is expected to score 0.39 times per match in tachi-waza. Put simply, that's about 2 expected scores in tachi-waza every 5 matches. Meanwhile, the benchmark group is expected to score nearly 2 times every 3 matches. The assumption we made is that the athlete needs to increase his scoring ability in tachi-waza. I propose that we first delve deeper into how scoring ability in tachi-waza is constructed in the data. The formula we use to calculate the expected number of scores per match is:
Efficiency percentage x Average number of attacks per match = Expected number of scores

Looking at Sporter 12 in the table, we see that on average he makes 3.16 significant attacks per match and converts about 12% of his attacks into a score. He scores just over 1 out of 10 significant attacks he attempts. Looking at the benchmark group's average, they attempt fewer attacks per match (2.59). However, they have an efficiency percentage averaging 25%, meaning they score 1 out of every 4 attacks. That is a significant difference compared to Sporter 12.
It appears that Sporter 12 makes enough attacks per match—his attack ratio is good, even better than the benchmark group's average. In fact, among all athletes in the benchmark group plus Sporter 12, he is in the top 4 for most significant attacks per match.
However, looking at efficiency, Sporter 12 scores lower than all athletes in the benchmark group. Among the athletes who stood on the Olympic podium in Paris, their efficiency percentages ranged between 22% and 29%, clearly higher than Sporter 12.
What does this mean?
The insight here is that Sporter 12 attacks enough in tachi-waza, but his efficiency leaves room for improvement. So the biggest gain lies in working on the efficiency of his attacks. If he keeps the number of attacks per match the same but improves his efficiency, his expected number of scores will increase significantly. For example, if he makes 3 attacks per match (currently 3.16) at an efficiency of 20% (scoring 1 in 5), his expected score in tachi-waza would be 0.60. This number is roughly the benchmark group's average and would increase his chances of winning an Olympic medal.
Expected number of scores against in tachi-waza
What else stood out is that Sporter 12 is expected to concede more scores (0.40) than he scores himself. The benchmark group shows a different balance, with an expected 0.28 scores conceded per match, which is less than half their expected scoring rate (0.64), creating a positive balance when looking at the ATWS. Our second assumption was that the athlete needs to reduce the expected number of scores conceded in tachi-waza. Below we dive deeper into how expected scores conceded are constructed in the data.
How is this constructed?
The formula we use to calculate the expected number of scores conceded per match is:
Opponent’s efficiency percentage in tachi-waza x Average number of attacks against per match = Expected number of scores conceded in tachi-waza

Number of attacks
Looking at the table, Sporter 12 is expected to face 2.44 attacks per match from his opponent. This compares to the benchmark group, which faces 1.84 attacks per match—a clear difference.
Efficiency
Looking at the efficiency of these attacks, 17% of the opponent’s attacks against Sporter 12 expect to convert into scores. For the benchmark group, this is on average 16%. So the efficiency of opponents is roughly the same for Sporter 12 and the benchmark group.
What does this mean?
The insight here is that Sporter 12 allows his opponents too much freedom to attack. The percentage of attacks converted into scores is not high, so Sporter 12 appears to defend well against attacks made. However, since the number of attacks he faces is significantly higher, he is likely to concede more scores overall if this continues. It appears that reducing the number of expected attacks against from 2.44 to 2.00 would be beneficial. Maintaining the opponent’s efficiency at 17% would reduce expected scores conceded to 0.34, which is clearly less than the current 0.40.
Scoring in ne-waza
When looking at the data related to ne-waza, we see that our athlete scores exactly on average, with no large difference from the benchmark. The assumption was that a deeper dive might reveal other findings, but regarding expected scores for and against, there are no large differences with the benchmark. However, only three of eleven athletes in the benchmark are expected to score more per match in ne-waza, indicating an area where our athlete might distinguish himself.

Number of scoring opportunities created
Looking at the table, Sporter 12 creates approximately 0.47 transitions from tachi-waza to ne-waza per match. This means he creates a scoring opportunity in ne-waza about once every two matches. The benchmark's average is 0.53, slightly higher but not significantly. It seems that quality differences in ne-waza might explain this; individual benchmark athletes vary between 0.19 and 1.04 scoring chances created per match. Sporter 12 falls somewhere in the middle.
Efficiency
Looking at efficiency, Sporter 12 scores on about 1 out of every 3 scoring chances created in ne-waza. The benchmark average is around 32%, roughly the same. However, among Olympic podium finishers in Paris, 3 out of 4 scored between 45% and 54%, clearly higher than Sporter 12.
What does this mean?
The insight here is that Sporter 12 already keeps pace with benchmark top scorers in ne-waza. It is worth investing more in this area, especially offensively.
We can increase expected ne-waza scores by raising average transitions per match from 0.47 to 0.75. According to the benchmark, this is a reasonable number of transitions leading to scoring chances per match. That would mean Sporter 12 creates a scoring chance in ne-waza in three out of four matches. I would also like to increase efficiency on these chances from 33% to 40%. Although a small difference, combined these improvements would raise expected ne-waza scores to about once every three matches (0.30). This would place him among the best ne-waza scorers in the benchmark group. It may sound ambitious but to achieve unique results, ambitious goals are necessary.
The total score (ATS)
Interestingly, unlike in the second article, let's finally look at the Adjusted Total Score (ATS). What can be done is to see what our proposed development points do to the ATS. The formula for ATS is:
Total expected scores made per match - total expected scores conceded per match = ATS
Adjusted Total Score
Looking at the benchmark group and benchmarks across all weight classes, a higher ATS seems a good predictor of judo success. This means that if you score more relative to the scores you concede, your chances of winning are higher. Logical, but as shown above, there's more that can be drawn from this conclusion.
Looking at Sporter 12, it is noticeable that his ATS value (0.08) is far from the benchmark group average (0.47). Also, he is expected to score almost as many as he concedes (0.54 scores made vs. 0.46 conceded).
In previous pieces, we analyzed ATS components and used data insights to determine how to improve Sporter 12. In other words, we considered where improvements are needed so he can have a chance at the ultimate goal (Olympic podium).
Expected scores in tachi-waza
Our first goal is increasing expected scores in tachi-waza by maintaining 3 attacks per match (currently 3.16) with a 20% efficiency (1 in 5), leading to an expected tachi-waza score of 0.60. The focus is mainly on improving attacking efficiency.
Expected scores against in tachi-waza
Secondly, reduce expected opponent attacks to 2.00 from 2.44. If opponent efficiency remains at 17%, expected scores conceded can drop to 0.34, less than the current 0.40.
Ne-waza
For ne-waza, focus mainly on ground attacks and transitions. The goal is for Sporter 12 to create scoring chances in ne-waza in three out of four matches. Efficiency on scoring chances should increase from 33% to 40%. Even a small increase combined with more scoring chances means expected ne-waza scores of about once every three matches (0.30).
Defensively, Sporter 12 concedes very little in ne-waza already, so further investment here may not be worthwhile.
What does this mean?
It’s interesting to see what our proposed adjustments do to the overall picture. Currently, Sporter 12's ATS is 0.08—low compared to the benchmark group's 0.48, indicating low chances for an Olympic medal with current scores.
If we achieve our proposed goals, Sporter 12 is expected to score 0.90 per match—meaning he scores in 9 out of 10 matches—higher than the benchmark average (0.80). Although expected scores conceded per match (0.39) remain slightly higher than the benchmark group (0.32), the ATS rises from 0.08 to 0.51 if these goals are met. This shows that seemingly small changes can lead to significant results.
An ATS of 0.51 would put Sporter 12 above the benchmark average (0.47), though the Olympic podium remains challenging given the average podium ATS of 0.65. Perhaps good penalty management and tactical savvy can help bridge this gap, though we have not addressed that here.
Advice
Now that our feelings and experience are not the sole drivers, but combined with hard data, we need to translate all this into practice. We must not disregard our judo expertise; the data adds one factor to our benchmark and knowledge to form a plan. Based on the data, here are some recommendations for Sporter 12, presented point by point, without yet delving into specific exercises.
Looking at the data and insights, we suggest adding these points to the benchmark, gap, and goal setting:
Improve attacking efficiency in tachi-waza
Technical refinement of techniques.
Coaching to recognize opening moments.
Building confidence in your techniques.
Reduce scores conceded in tachi-waza
Targeted kumikata training to win grip situations and gain dominance.
Defensive drills to minimize opponent scoring chances.
Use video analysis to identify and avoid mistakes.
Increase scoring chances in the transition from tachi-waza to ne-waza
Foster a mindset seeing ne-waza as a major opportunity to outperform the competition.
Train transitions thoroughly to practice complete sequences, not just isolated ne-waza techniques.
Emphasize in randori that every transition from tachi-waza to ne-waza is a scoring opportunity.
Increase efficiency in ne-waza
Choose a ne-waza system where techniques complement each other, avoiding 'loose ends.'
Integrate ne-waza into tachi-waza seamlessly; the game always starts in tachi-waza.
Perfect the execution of ne-waza techniques and ensure they flow based on opponent reactions.
If these recommendations are incorporated into the comprehensive plan toward the end goal, Sporter 12’s chance of winning an Olympic medal increases. Remember, data use is only one part of planning; knowledge, expertise, and experience remain invaluable in determining the development path.
At Katalyst Performance Consulting, we believe data analysis can make a difference in athlete projects. Whether you are an athlete, coach, federation, or club, we are ready to help turn data into action. We support you with implementing data analysis in your projects, gaining insights that can significantly enhance your performance. We believe data analysis is valuable not only for the absolute top but also plays a role in talent development.
Want to know how we can support your training, strategies, or organization with data-driven insights? Feel free to contact us via info@katalystperformance.nl. We’re happy to think along and look forward to partnering with you to reach your ultimate goal.